This post originally appeared in the Health Affairs Blog
In April 2018, the Centers for Medicare and Medicaid Services (CMS) released a final report summarizing Affordable Care Act (ACA) enrollment data during the fifth open enrollment period (OEP) (2018) for all fifty states and the District of Columbia. Along with the national data, CMS also released state-level data on plan selections and demographic characteristics of consumers. This blog post is an attempt to understand and compare the Texas ACA enrollees with national ACA enrollees.
The numbers continue to show that most Texans and Americans who previously enrolled in ACA marketplaces want to keep their coverage. More than 80 percent of Texas and national ACA enrollees continue to find affordable health coverage in the marketplaces—because of federal tax credits—despite increases in premiums. And the data also show the critical role of ACA marketplaces in driving down uninsured rates in Texas and nationally.
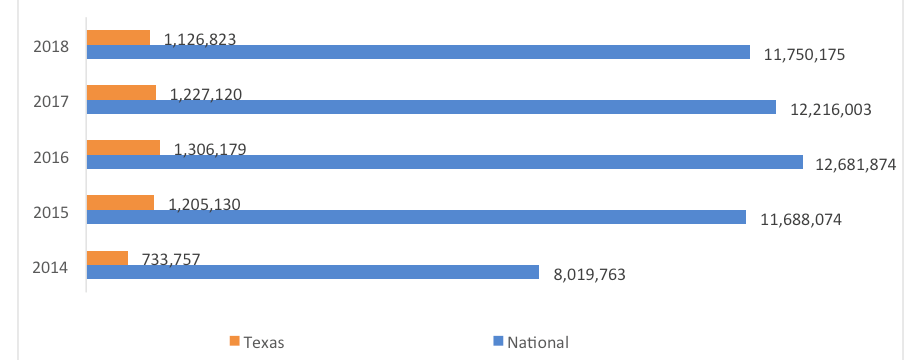
In 2018, total Texas ACA enrollment, which is about one-tenth of the national ACA enrollment total, follows the national trend as to numbers of enrollees (see Figure 1). When looking at the data across all five OEPs, the ACA enrollment figures—for both Texas and the nation—reached their peak during the 2016 OEP and have since leveled off slightly.
Exhibit 1: Texas Versus National ACA Marketplace Enrollment, 2014–18

Source: Centers for Medicare and Medicaid Services, Marketplace Open Enrollment Period Public Use Files, 2015–18 (Baltimore, MD: CMS), and Office of the Assistant Secretary for Planning and Evaluation (ASPE), Department of Health and Human Services, Health Insurance Marketplace: Summary Enrollment Report (Washington, DC: ASPE, HHS, 2014.).
Similarities
Recently, Episcopal Health Foundation (EHF) released an analysis of the demographic profile of Texas ACA enrollees during the fifth OEP. When comparing our Texas findings with the highlights of ACA enrollees nationally from the CMS final report, we found many remarkable similarities.
- 31 percent of Texas enrollees were new consumers of health insurance compared to 27 percent nationally;
- 55 percent of Texas enrollees were female compared to 54 percent nationally;
- 87 percent of Texas enrollees were in nonrural areas compared to 82 percent nationally;
- 37 percent of Texas enrollees were ages 35-54 as compared to 36 percent nationally;
- 76 percent of Texas enrollees reported household income between 100 percent and 250 percent of the federal poverty level (FPL) as compared to 70 percent nationally;
- 64 percent of Texas enrollees selected a Silver plan as compared to 63 percent nationally;
- 86 percent of Texas enrollees received financial assistance in the form of premium tax credits as compared to 83 percent nationally;
- The average premium costs increased by 35 percent (from $403 per month to $543 per month) in Texas as compared to the national increase of 30 percent (from $476 to $621).
- When factoring in federal tax credits, the average premium cost for Texas enrollees was $79 per month, as compared to the national average of $89 per month.
Texas Enrollment Concentrated In Urban Areas
ACA marketplace enrollment in Texas tends to concentrate in urban, metropolitan areas. In the 2018 OEP, only 13 percent of marketplace enrollees in Texas lived in rural areas. This likely stems from a combination of factors in rural areas including a much smaller population, fewer ACA plans being available in rural areas, and lack of organized efforts there to help people sign up for ACA plans. (Most of the organized efforts to promote and sign up people are in the urban areas of Texas.)
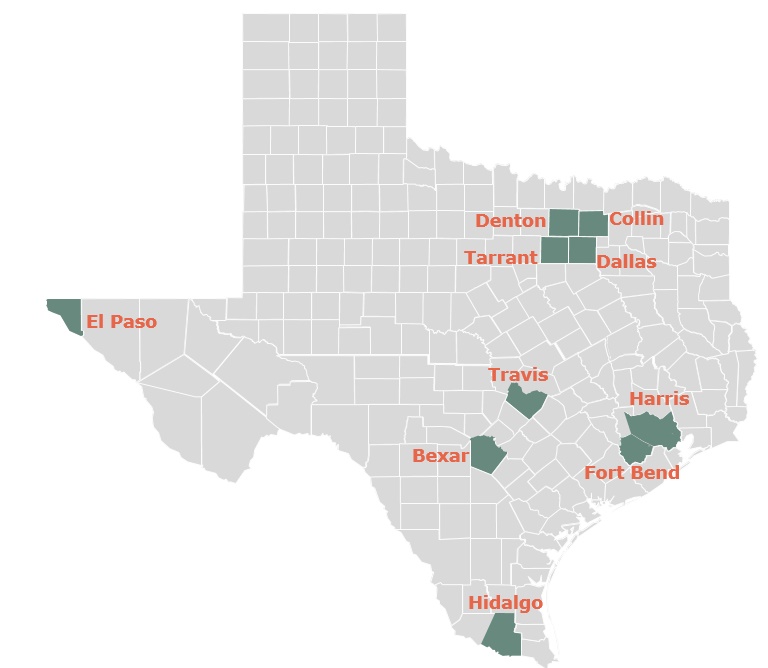
As seen in Figure 2 below, just ten urban counties (Harris, Dallas, Tarrant, Bexar, Travis, El Paso, Collin, Fort Bend, Denton, and Hidalgo) represented 66 percent of all marketplace enrollees (or 740,171 enrollees) in Texas during that fifth OEP. These ten urban counties are part of the six largest metropolitan statistical areas (MSAs) in Texas. Those counties are where close to 80 percent of Texans reside.
Exhibit 2: Ten Texas Counties With The Highest Numbers Of ACA Enrollees

Source: CMS, 2018 Marketplace Open Enrollment Period Public Use Files (Baltimore, MD: CMS, 2018).
More Findings And A Recommendation
Both national and Texas ACA enrollment figures dropped only slightly in the 2018 OEP to 11.8 million and 1.1 million, respectively, despite several congressional efforts to repeal and replace the ACA in 2017, the shortened enrollment period (from three months to seven weeks), and public confusion about the ACA.
This is especially noteworthy considering two of the counties in Texas, Harris and Fort Bend, were hit hard by Hurricane Harvey and yet reported high enrollment numbers, at 229,493 and 50,700, respectively. While the federal government did extend the enrollment deadline until December 31, 2017 (instead of December 15, 2017) for the forty-one counties in the Gulf Coast region of Texas (as well as other affected hurricane-impacted areas in Florida and Puerto Rico), the publicly available enrollment data from CMS only covers the enrollment period until December 15, 2017.
Of the ACA enrollees, about seven in ten were returning enrollees in both Texas and nationally—another strong indication that the majority of Texans and Americans who were enrolled in ACA health care coverage want to keep their coverage.
Due in large part to the decision of the Department of Health and Human Services (HHS) to terminate cost-sharing reduction (CSR) payments to insurers, the average premium increased by 35 percent in the Texas ACA marketplace and 30 percent in the national ACA marketplaces during the fifth OEP. However, since the amount of financial assistance to consumers is based on a formula directly linked to premium costs, federal financial assistance also increased. As our data show, 86 percent of Texas enrollees and 83 percent of national enrollees received premium tax credits in the fifth OEP and therefore were largely shielded from any direct financial impact of premium increases.
Nevertheless, the 14 percent of Texas enrollees and 17 percent of national enrollees who did not receive premium tax credits (mostly because of their incomes being above the eligibility level) did experience the financial effects of the premium increases.
While Texas has reduced its uninsured rate from 22.1 percent in 2013, when the ACA individual market plans first became available, to 16.6 percent in 2016 (most recent year available), it still maintains the highest uninsured rate in the nation, at 16.6 percent.
Texas also has the highest number of uninsured residents at 4.7 million.
The numbers show that an overwhelming majority of Texans enrolled in the ACA marketplace are returning enrollees and are largely shielded from the premium increases because of federal tax credits. Any discussion to eliminate the ACA marketplace without a clear policy alternative would risk adding another 1.1 million Texans to the uninsured population and returning the state uninsured rate to more than 20 percent.
As Congress continues to look for ways to reform the ACA legislation, policy makers at both federal and state levels should carefully consider alternatives that expand health insurance coverage for low-income Texans and Americans who need affordable coverage.
