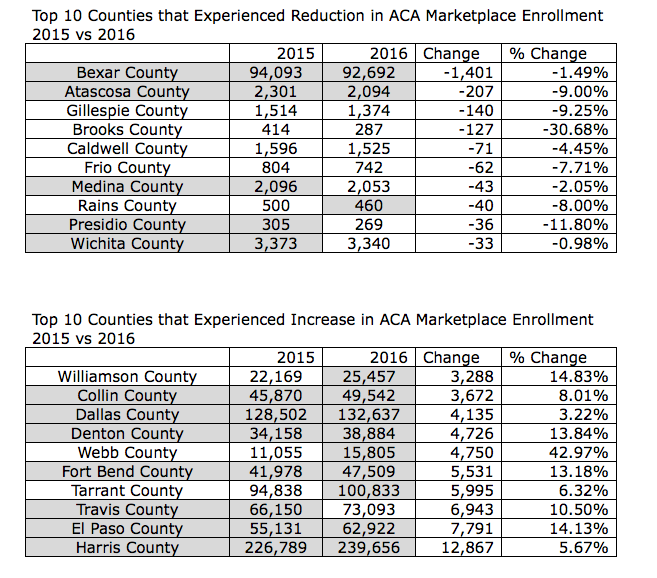
More than 1.3 million Texans enrolled in Affordable Care Act Marketplace health insurance plans from November 2015-February 2016, according to new numbers released by the US Department of Health and Human services. The new numbers show the state’s enrollment increased by more than 100,000 compared to 2015.
The interactive map below shows ACA health insurance enrollment by county in 2016, including the increase or decrease from 2015 enrollment.
- Each county is represented by a circle. Hover over the circles to see data on ACA Marketplace enrollment for that county.
- The size of the circles are proportional to the number of residents in that county who enrolled in an ACA Marketplace plan in 2016.
- The color of the circles correspond to the percent change in the number of ACA Marketplace enrollees from 2015 to 2016 for each county.

“Interestingly, Bexar County actually has seen the highest decrease (1,401) in ACA enrollment from 2015 to 2016,” said Shao-Chee Sim, EHF’s VP for Applied Research. “While it’s surprising, the figure is only 1.5% of the total enrollment in Bexar County. The rest of the counties seeing lower enrollment numbers are largely rural counties.”
Harris County experienced the largest increase in ACA enrollment – 12,867 more people enrolled in 2016 compared to the year before. Other counties experiencing enrollment increases include El Paso, Travis, Tarrant and Fort Bend.
“It’s no surprise that these are mostly urban counties,” Sim said.
