![]()
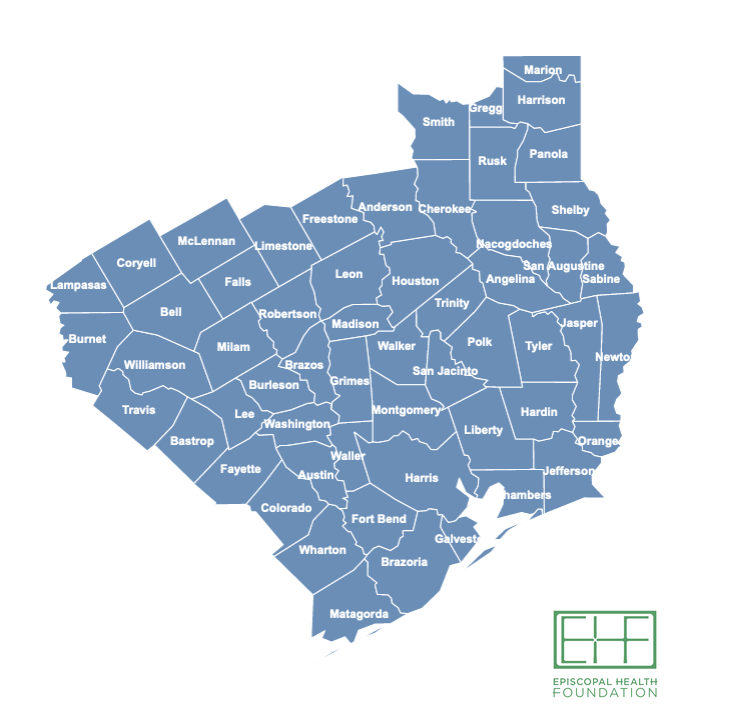
Click on the map above to use EHF’s new 2019 County Health Snapshots tool
By Emily Dean, EHF Research Associate
EHF’s 2019 County Health Snapshots present county-level data for community leaders and clinics to assess health outcomes and the non-medical, social determinants of health in each of the 57 counties served by the Episcopal Diocese of Texas (EDOT).
The data presented in the 2019 Snapshots reflect EHF’s priorities to serve vulnerable populations and promote health, not just healthcare. Health disparities, uninsured rates, and poverty rates are featured across five topic areas.
- Population Profile – demographics, language, and income
- Health Outcomes – mortality, well-being, and child health
- Access to Care – uninsured rates, health care providers, and preventable hospitalizations
- Social Factors – poverty, housing, food environment, crime, education, and employment
- Behavioral Factors – physical inactivity, substance abuse, and other high-risk behavior
WATCH NOW: This video explains how to navigate and use EHF’s County Health Snapshots
The information for the snapshots was sourced from Robert Wood Johnson Foundation’s County Health Rankings, Centers for Disease Control and Prevention, U.S. Census Bureau, Texas Department of State Health Services and Texas Workforce Commission.
EHF’s County Health Snapshots are designed to view one county at a time, and each county profile tells its own story. However, two key trends emerge when looking at all EDOT counties together as a region.
First, Texas continues to have the highest uninsured rates in the U.S. among children and non-elderly adults. In EHF’s region, the average uninsured rate is 16.7% (ages 0-64), compared to a national rate of 10%. Second, health disparities persist in our communities.
New in 2019, users will find links in the Sources tab to additional data resources with information at the sub-county or Census-tract level.